When you pick up a prescription for a generic drug, you might think you’re just saving a few dollars. But behind that simple swap is a complex system of economic calculations that shape how billions of dollars are spent in healthcare every year. Cost-effectiveness analysis isn’t just an academic exercise-it’s what determines which drugs get covered, which ones get pushed to the back of the shelf, and who ultimately pays the bill.
Generic drugs aren’t just cheaper copies. They’re often the most powerful tool we have to control healthcare spending. In the U.S., generics make up 90% of all prescriptions filled, but they account for only 17% of total drug spending. That’s not a coincidence. It’s the result of smart economic decisions driven by cost-effectiveness analysis. When a brand-name drug loses its patent, multiple generic manufacturers jump in. The first one might drop the price by 40%. By the time six or more generics are on the market, the price can plummet over 95% below the original brand cost. That’s not just savings-it’s a financial earthquake in the pharmaceutical market.
How Cost-Effectiveness Analysis Works for Generics
Cost-effectiveness analysis (CEA) compares the cost of a treatment to the health benefits it delivers. For generics, that means asking: Does this cheaper version give me the same result as the expensive one? The answer is almost always yes. But the real challenge isn’t proving equivalence-it’s figuring out which generic is the best value.
The key metric used is the incremental cost-effectiveness ratio, or ICER. It tells you how much extra you pay to get one more quality-adjusted life year (QALY). For example, if Generic A costs $50 and gives you the same outcome as Generic B at $120, the ICER shows you’re getting $70 worth of unnecessary spending. Simple math, right? But here’s where it gets messy.
Many studies fail to account for what happens next. A 2021 ISPOR report found that 94% of published CEAs don’t even try to predict how prices will drop after new generics enter the market. That’s like betting on a stock price based on yesterday’s closing value-ignoring the fact that tomorrow’s news could crush it. If you’re evaluating a drug just before its patent expires, and you ignore the flood of generics coming next year, your analysis will wrongly make the brand look more cost-effective than it really is.
The Hidden Price Gaps in Generic Drugs
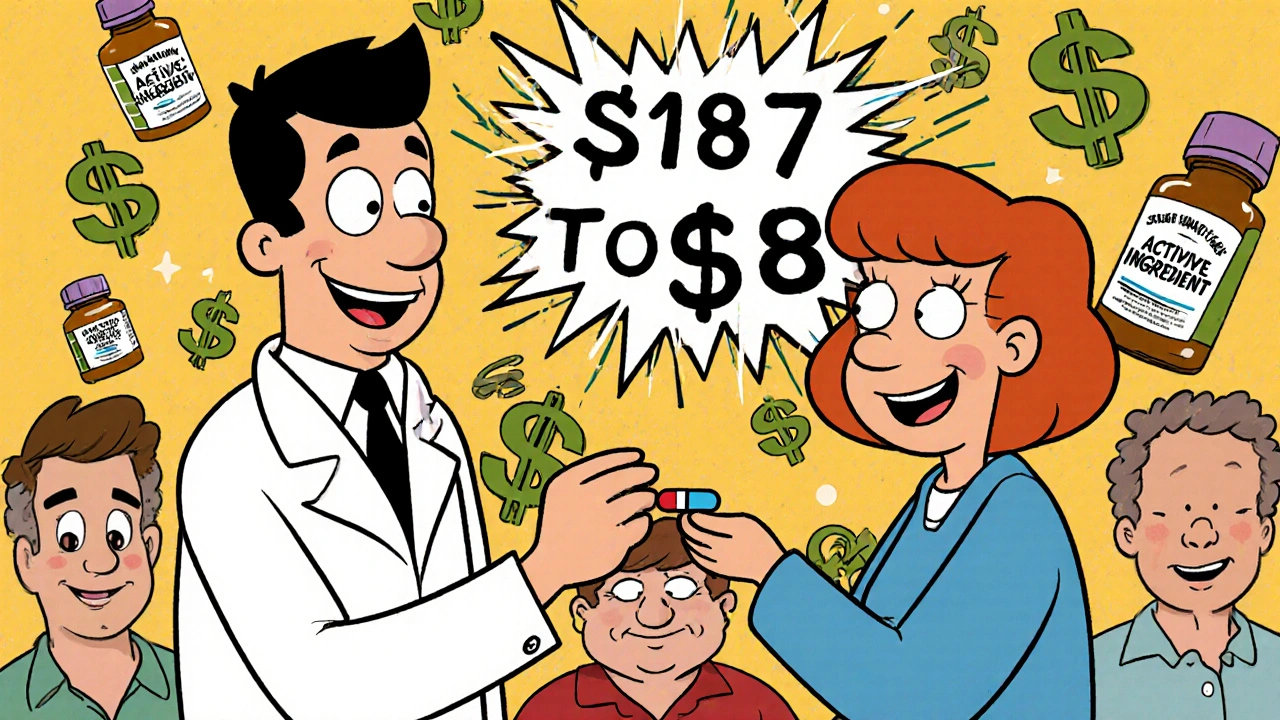
Not all generics are created equal-even when they’re the same drug. A 2022 study in JAMA Network Open looked at the top 1,000 generic drugs and found something shocking: some generics cost more than others for the exact same medicine. One drug, used to treat high blood pressure, had multiple generic versions priced at $12, $48, and $187 per month. All had the same active ingredient. All were approved by the FDA. Only the price changed.
Why? Because some of these weren’t direct generic substitutes. They were different formulations-different tablets, different doses, different brands under the same generic name. The study found that when patients switched from a high-cost generic to a lower-cost alternative in the same therapeutic class, savings jumped to nearly 90%. In one case, total spending dropped from $7.5 million to under $900,000 just by choosing cheaper options.
The biggest price gaps? Between drugs that are chemically identical but sold under different labels. The median price difference between two identical generics from different manufacturers was just 1.4 times higher. But when the substitution meant switching to a different drug in the same class (like switching from one statin to another), prices jumped 20 times higher. That’s not a pricing error-it’s a market failure.
Who’s Really Controlling the Prices?
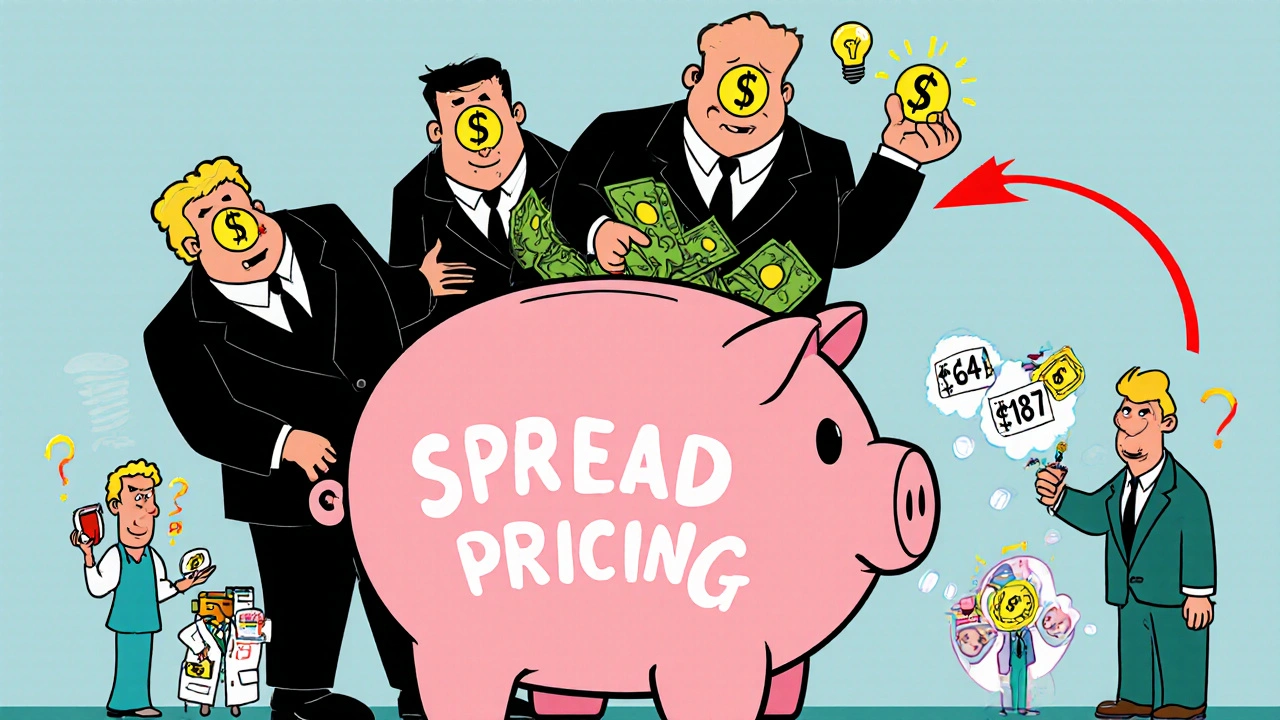
It’s easy to blame drug companies. But the real bottleneck often sits between the pharmacy and the insurer: Pharmacy Benefit Managers (PBMs). These middlemen negotiate prices with drugmakers and pharmacies. Their profit? The difference between what they pay the pharmacy and what they charge the insurer. That’s called spread pricing.
Here’s how it works: A PBM might agree to pay a pharmacy $10 for a generic pill, but charge the insurer $40. The $30 spread goes straight to the PBM’s pocket. Even if a cheaper $8 version exists, the PBM has no incentive to switch-it still pockets $32. The patient pays less, sure, but the system doesn’t save money. And because most CEAs don’t track PBM pricing structures, they miss this whole layer of distortion.
This isn’t theoretical. In states that have banned spread pricing, generic drug costs dropped an average of 25% within a year. But without transparency, CEA models keep treating PBMs as neutral actors-when they’re actually profit-driven gatekeepers.
Why Patents Matter More Than You Think
Drug companies don’t make money selling pills. They make money selling exclusivity. When a patent expires, the market shifts overnight. But most cost-effectiveness analyses treat drug prices as fixed. That’s like pricing a smartphone based on last year’s model-ignoring the new version that just dropped.
Dr. John Garrison, a health economist, calls this a “pricing anomaly.” If you analyze a drug before its patent expires and assume the price will stay high, you’ll wrongly conclude it’s cost-effective. But once generics hit, the price collapses. The analysis becomes useless. Worse-it might block access to cheaper alternatives because the system thinks the brand is the better value.
The NIH recommends that any CEA for a drug nearing patent expiry must include a forecast of generic entry. That means modeling price drops over time, not just picking one snapshot. Some agencies, like ICER, do this well. Most don’t. The result? Hospitals and insurers keep paying inflated prices for months-or years-after cheaper options become available.
Therapeutic Substitution: The Secret Savings Tool
Here’s a trick most patients don’t know: You don’t always need the exact same drug. Sometimes, switching to a different drug in the same class saves you more than switching to a generic.
Take statins. Atorvastatin (Lipitor) has a generic. But so does rosuvastatin (Crestor). And simvastatin. And pravastatin. All lower cholesterol. All proven effective. But their prices? Vastly different.
A CEA that only compares brand vs. generic misses this. A smarter analysis compares all options in the class. The JAMA study showed that choosing the lowest-cost drug in a therapeutic group-not just the cheapest generic-could cut spending by over 88% in some cases. That’s not substitution. That’s strategic therapy.
But this requires clinicians and pharmacists to have access to real-time pricing data. Most electronic health records still don’t show it. Without that, even the best CEA can’t be applied in practice.
What’s Changing-and What’s Not
Europe leads the world in using CEA to guide drug coverage. Over 90% of health technology assessment agencies there use formal cost-effectiveness models. In the U.S., only 35% of commercial insurers do. Medicare, which covers 65 million people, still relies mostly on historical pricing-not economic analysis.
But things are shifting. The 2022 Inflation Reduction Act gives Medicare new power to negotiate drug prices. And with over 300 small-molecule drugs losing patent protection between 2020 and 2025, the pressure to get this right is growing. The FDA estimates that generics saved the U.S. healthcare system $1.7 trillion between 2007 and 2017. That’s $250 billion a year. Imagine what we could save if we stopped paying $187 for a pill that costs $8.
The next frontier? Making CEA dynamic. Not static. Not one-time. But continuously updated as new generics enter the market. That means integrating real-time pricing feeds into formulary systems. Training pharmacists to recognize therapeutic alternatives. And holding PBMs accountable for transparent pricing.
It’s not about being anti-brand. It’s about being pro-value. If two drugs do the same job, and one costs 20 times less, the question isn’t whether you can afford the cheaper one. It’s why you’re still paying for the expensive one.
What is cost-effectiveness analysis for generic drugs?
Cost-effectiveness analysis (CEA) for generic drugs compares the price of a generic medication to the health outcomes it delivers, relative to other treatment options. It helps determine whether switching from a brand-name drug-or from one generic to another-provides better value for money. The goal is to maximize health benefits while minimizing costs, using metrics like cost per quality-adjusted life year (QALY).
Why do some generic drugs cost more than others?
Two generics with the same active ingredient can have wildly different prices due to factors like manufacturer branding, packaging, distribution deals, and how Pharmacy Benefit Managers (PBMs) structure their pricing. Sometimes, higher prices come from different dosage forms or formulations-not clinical differences. A 2022 study found that identical generics from different makers cost up to 1.4 times more, while different drugs in the same class could cost 20 times more.
How do Pharmacy Benefit Managers (PBMs) affect generic drug pricing?
PBMs profit from "spread pricing," meaning they charge insurers more than they pay pharmacies for drugs. Even if a cheaper generic exists, PBMs may keep higher-priced versions on formularies because their profit margin is larger. This creates a hidden cost that cost-effectiveness analyses often miss, since they don’t track PBM revenue structures.
Can switching to a different drug save money instead of just using a generic?
Yes. Sometimes the cheapest option isn’t the generic version of your current drug-it’s a different drug in the same therapeutic class. For example, switching from a high-cost statin to a lower-cost one can save up to 90% compared to sticking with an expensive generic. This is called therapeutic substitution, and it’s one of the most underused cost-saving tools in healthcare.
Why do most cost-effectiveness analyses fail to predict generic price drops?
A 2021 study found that 94% of published CEAs don’t account for future generic entry. They use current prices as if they’ll stay the same, ignoring the inevitable price collapse after patents expire. This makes brand-name drugs look more cost-effective than they really are, leading to poor coverage decisions. Experts say CEAs must include dynamic pricing models that forecast generic competition.
How much money have generic drugs saved the U.S. healthcare system?
According to the FDA, generic drugs saved the U.S. healthcare system approximately $1.7 trillion between 2007 and 2017. That’s an average of more than $250 billion per year. In 2022, generics accounted for 90% of prescriptions filled but only 17% of total drug spending, proving their massive economic impact.
What Comes Next?
The future of generic drug pricing isn’t about more generics. It’s about smarter decisions. Healthcare systems need to move beyond static price lists and build systems that automatically update cost-effectiveness models as new generics enter the market. Clinicians need tools that show them the cheapest effective option-not just the one on the formulary. And regulators need to force transparency from PBMs.
Right now, we’re leaving billions on the table. Not because generics don’t work. But because we’re not using them the way they were designed to be used.
Melvina Zelee
November 23, 2025 AT 06:10man i never thought about how a $187 pill and an $8 pill could be the exact same thing. it's wild how the system just lets that happen. like, if i bought two different brands of salt, i wouldn't pay 20x more for the one with fancier packaging. but medicine? yeah, sure, whatever.
Robin Johnson
November 24, 2025 AT 17:42the real issue isn't generics-it's that no one's forcing PBMs to disclose their spreads. if you don't know how much they're skimming, your whole cost analysis is garbage. we need transparency laws, not more studies.
Latonya Elarms-Radford
November 26, 2025 AT 03:32oh sweet celestial bureaucracy, we are living in the dystopian opera of pharmaceutical capitalism where the only thing more tragic than the price of a pill is the fact that we've normalized it. the ICER doesn't just measure cost per QALY-it measures the soul's depreciation in the face of institutionalized greed. we've turned healing into a spreadsheet, and the gods of profit have taken their seat at the table, sipping champagne while patients choose between insulin and rent. and don't get me started on PBMs-they're not middlemen, they're vampires in tailored suits, draining the lifeblood of care while claiming to be efficiency experts. this isn't healthcare reform, this is a requiem for common sense.
Mark Williams
November 27, 2025 AT 06:13the lack of dynamic modeling in CEA is a structural flaw. most models treat price as a static variable, ignoring elasticity, market saturation, and entry timing. when you fail to simulate the post-patent price trajectory, you're essentially optimizing for obsolescence. integrating real-time formulary feeds and FDA generic entry forecasts into decision engines isn't optional-it's the baseline for any credible HTA.
Daniel Jean-Baptiste
November 28, 2025 AT 22:26the 90% savings stat is insane. why are we still using the expensive generic if the cheap one does the same thing? seems like a no brainer. maybe docs just dont have the tools to see the prices. someone should build a plugin for epics.
Ravi Kumar Gupta
November 29, 2025 AT 19:02in india we have generics so cheap they're almost free-like 2 rupees for a blood pressure pill. but here? you pay like you're buying a luxury watch. this is not science, this is robbery with paperwork. america you are being played.
Rahul Kanakarajan
November 30, 2025 AT 12:50everyone keeps talking about PBMs like they're the villains. but let's be real-doctors are the ones prescribing the expensive ones. if they just checked the price before writing the script, half this mess wouldn't exist. stop blaming middlemen and start blaming the prescribers who don't care.
David Cunningham
December 2, 2025 AT 01:30so basically we're paying for branding on pills? that's wild. i just want the thing to work, not the logo on it.
luke young
December 3, 2025 AT 08:14just read the part about therapeutic substitution-this is the kind of stuff that could actually fix the system. if we taught pharmacists to suggest cheaper alternatives in the same class, we could save billions without touching a single patent. why isn't this standard practice yet?